Blog 4: Incumbency
10/5/20
Incumbency Advantage; is it Real?
Do voters only remember the losses rather than the gains from each incumbent candidates and party? How much of an advantage does incumbency give a candidate? How about party?
When considering the incumbency advantage in elections, there has been conflicting views in the literature of how much incumbency itself affects the final decisions for voters. In the Journal of Experimental Political Science, Brown1 suggests that voters don’t have strong general preferences for or against incumbent candidates in elections when all other factors are set equal. In another journal article from PS: Political Science and Politics, Campbell2 suggests that imcumbent presidents tend to have higher popular vote ratings than incumbent parties that are who have held the white house for 2 or more terms.
Lets look back at the past elections between the years of 1948-2016 in Figure 1. The number of incumbent presidents who were reelected were 6 out of 17; the number of incumbent party candidates who won the election were 2 out of 17. The rest were won by the challengers.
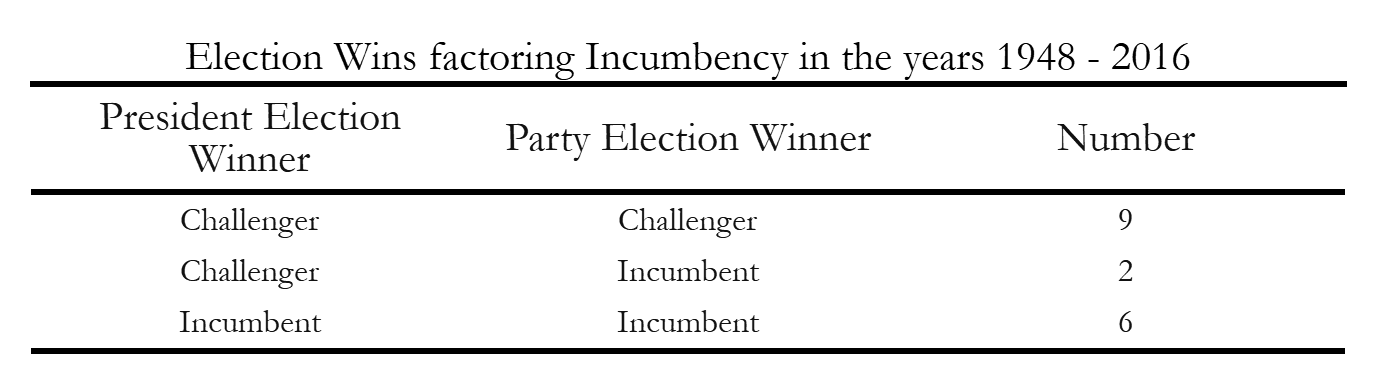 Figure 1: Incumbent Presidential Reelection Winners
These results show us that there seems to be a pretty well maintained balance between winners between incumbents (whether that be party or president) and challengers. Voters tend to like having these periodic alterations in power between the two major parties, and we’ll explore which economic factors tend to favor one party versus another in incumbency.
But first, lets see how popular vote distributions are between incumbent candidates (as either president or party) and challengers.
Challenger V.S. Incumbent Candidates Popular Votes
In Figure 2, we can track the patterns and trends of voters swaying from challenger to incumbent every election year. The triangles represent the challenger, and the circles represent the incumbent. Each of the candidates are also colored by the specific party they represent.
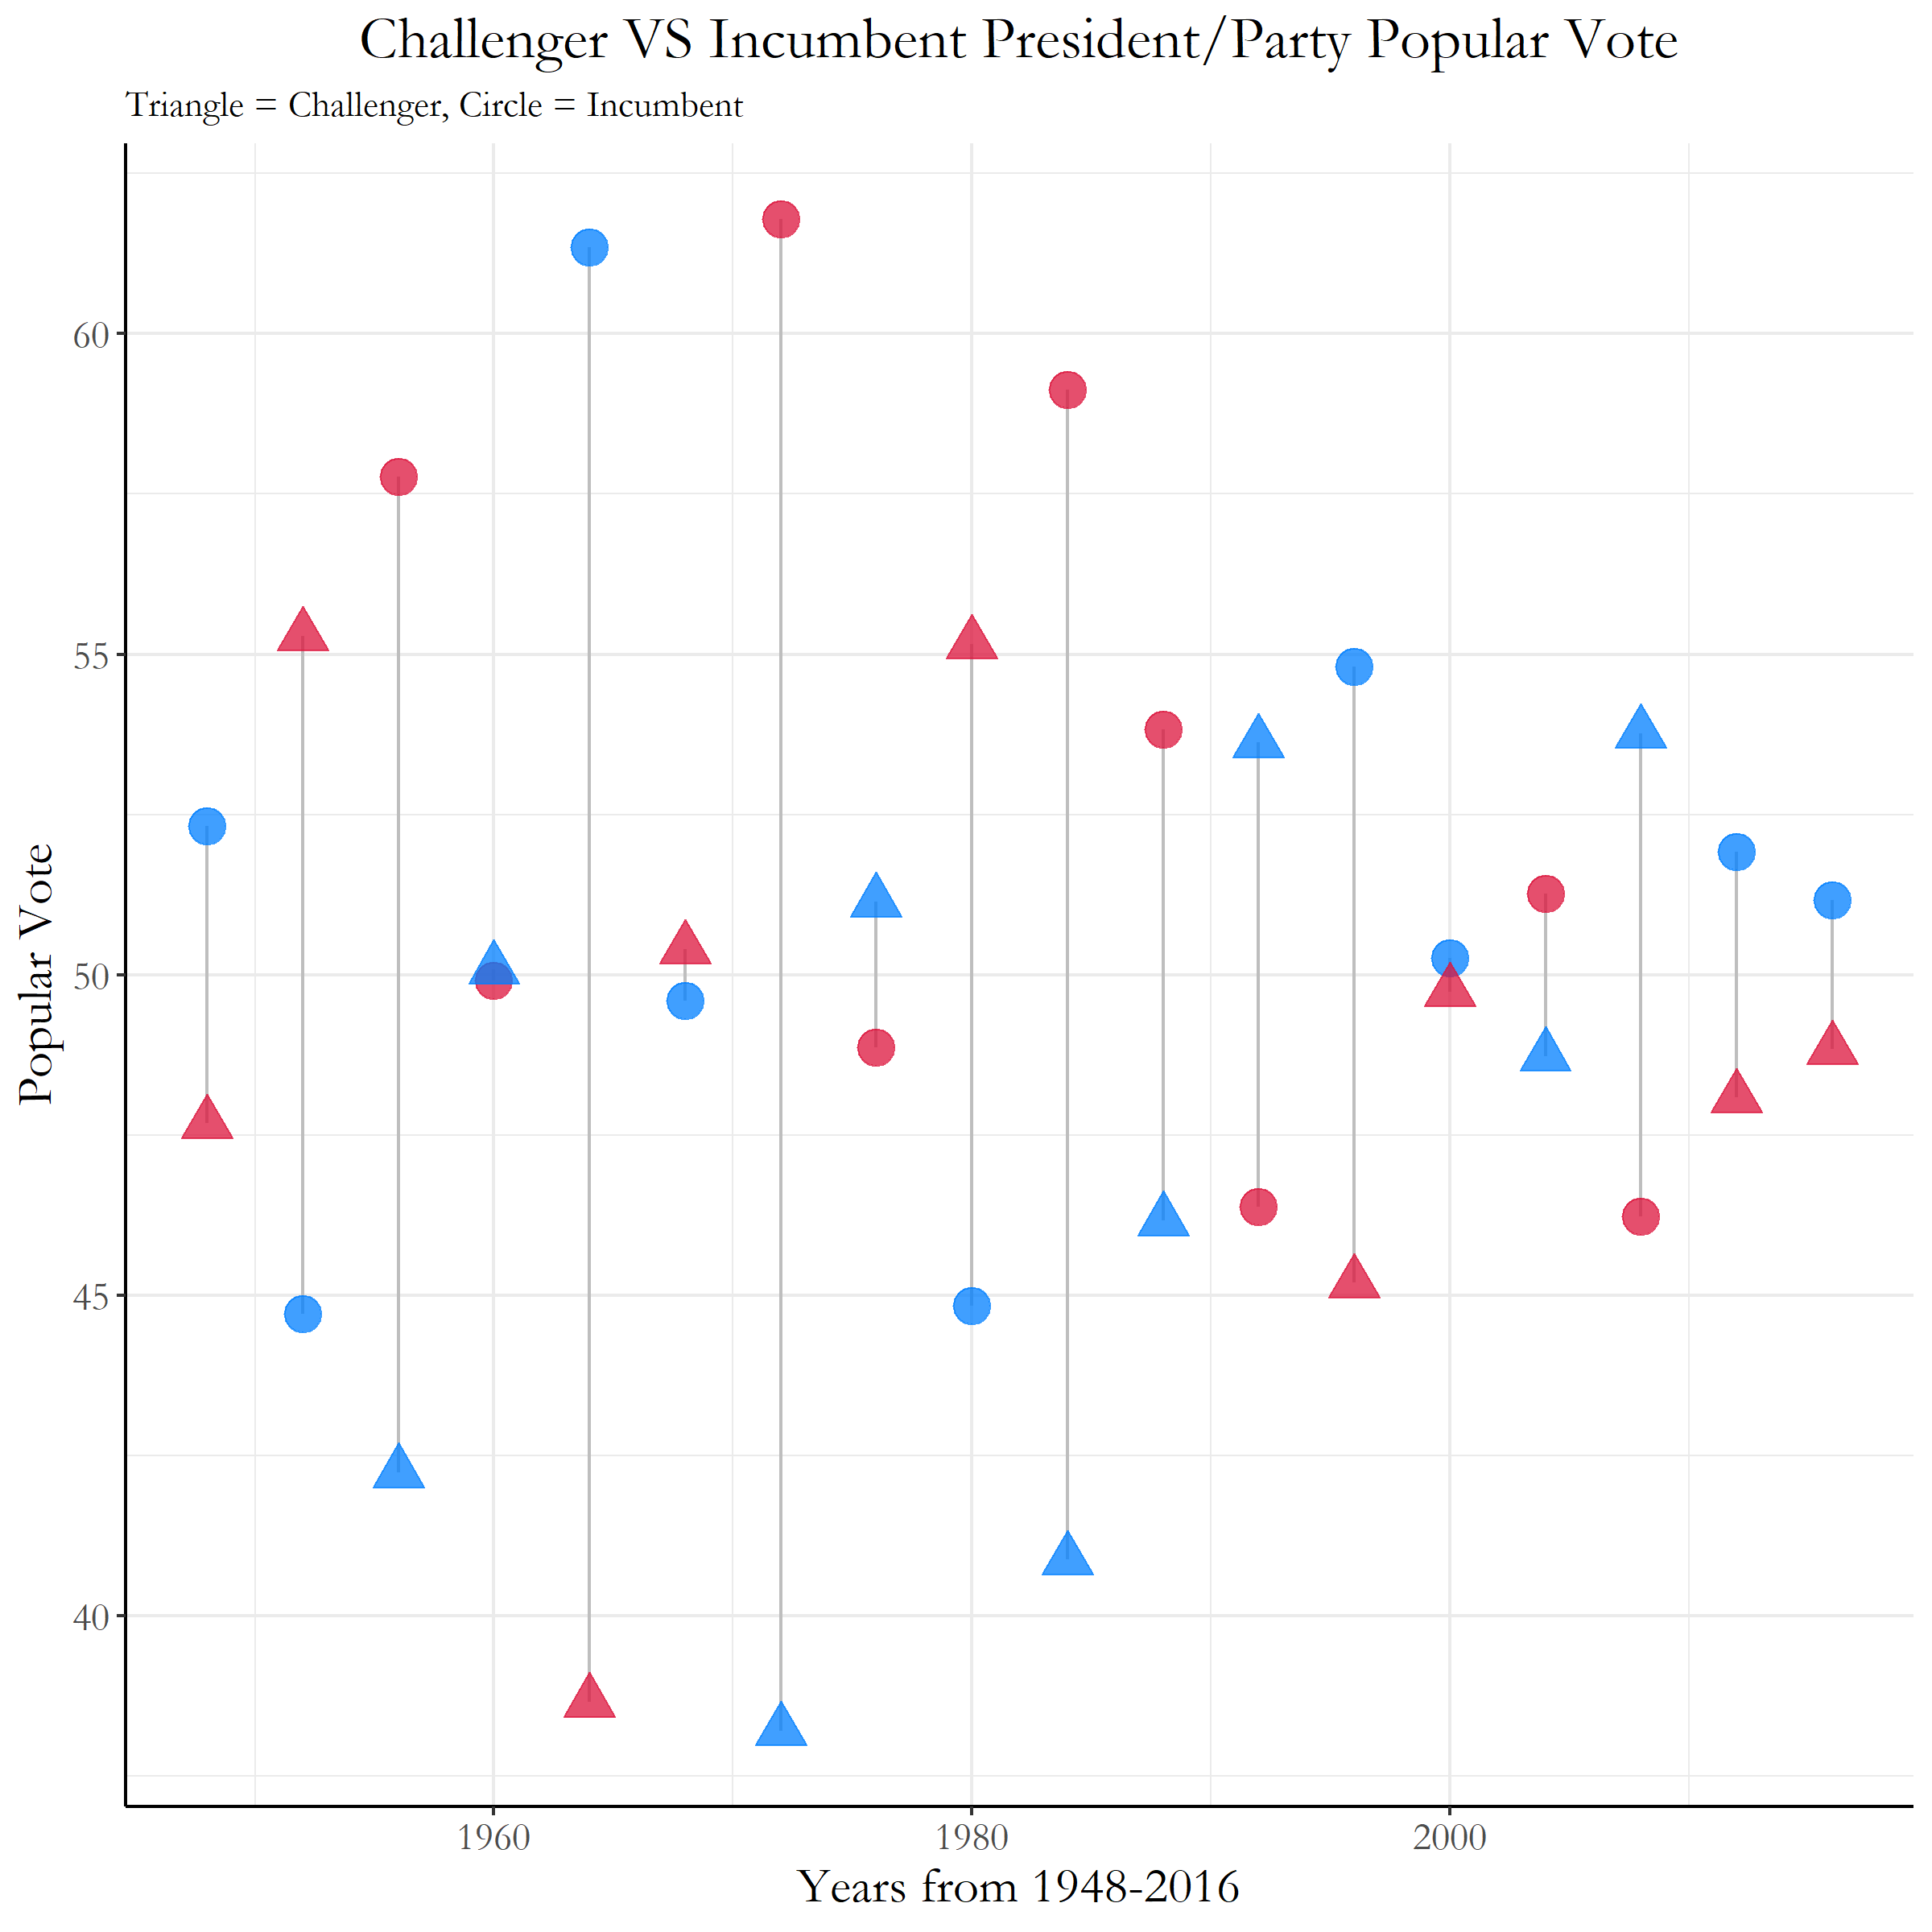 Figure 2: Popular Vote Between Incumbent Candidates and Challengers
There are very steady transitions within this graph, where the voters choose to elect the challengers typically every two cycles, and whenever the challenger does win, it also marks a switch in the political party that is in the white house. Since we know that voters tend to give both incumbents and challengers similar chances, lets revisit the economic models we had in week 2 to see which variables hurt or help incubments and challengers.
Economy and Incumbency
Now, lets reexplore the Economy and Incumbency. When running lapply over all of the economic variables we have within our econ.csv dataset for only the incumbent candidates, we are able to get the following coefficients in Figure 3.
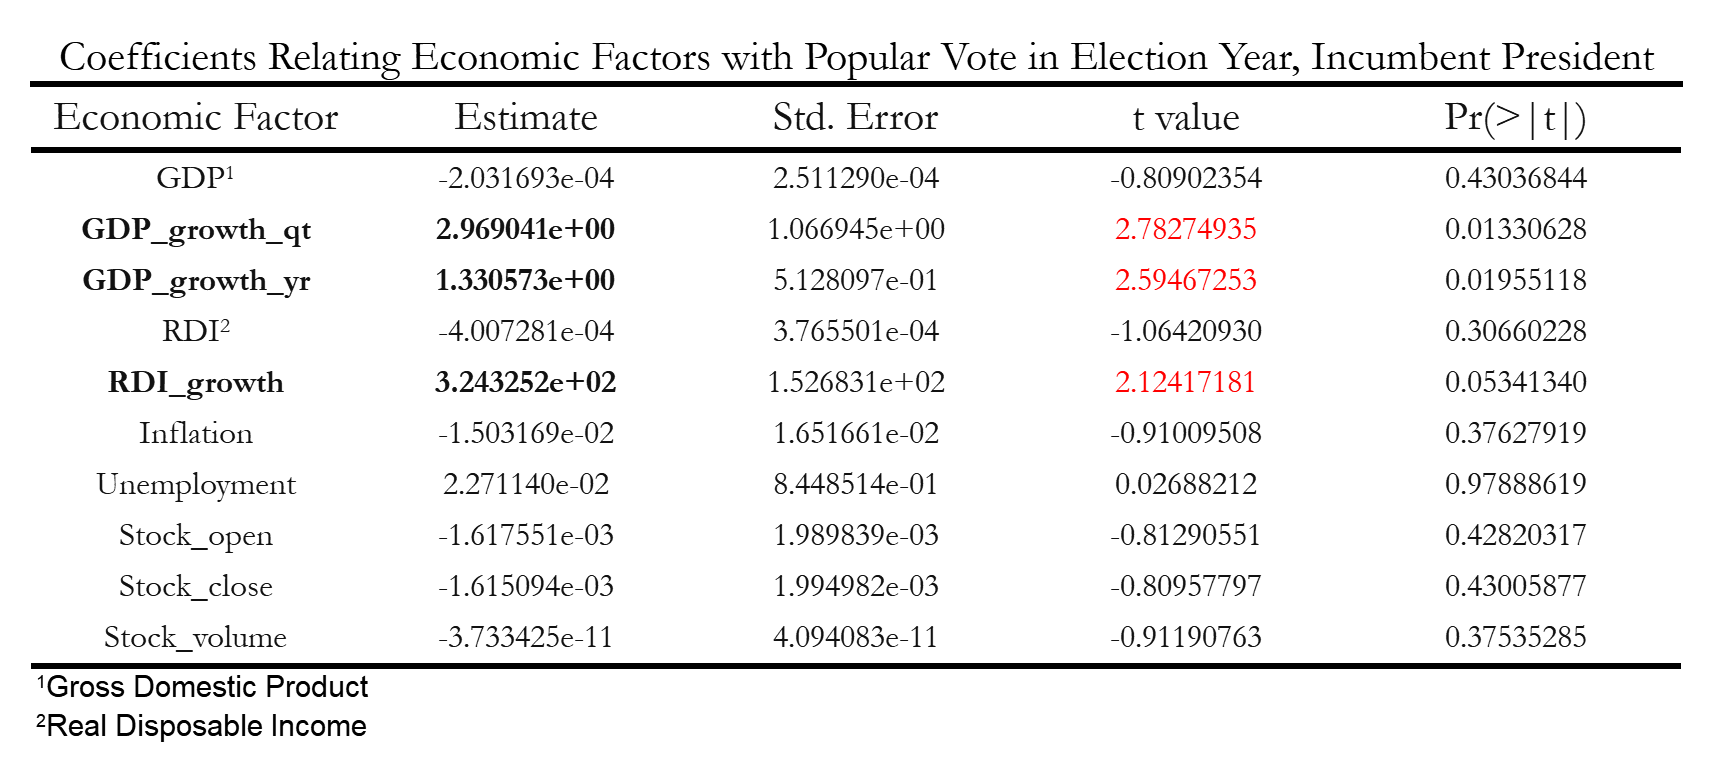 Figure 3: Coefficient Incumbent
The t-values with higher values than 2 are highlighted in red, which lets us know that the variables GDP_growth_qr, GDP_growth_yr, and RDI_growth are the most significant variables within this dataset that can model the number of popular votes the incumbent president would receive in an election. All three variables seem to have a positive correlation with popular vote, where one percentage increase in any of these would raise the percentages of the incumbent candidate’s popular vote by 3.0% (GDP_growth_qr), 1.3% (GDP_growth_yr), and 2.4% (RDI_growth).
Economy and Challengers
Running this same procedure with the challengers data we have compared to the economic variables, we don’t seem to identify any specific variables that could be accurate in predicting the popular vote for a challenger (Figure 4).
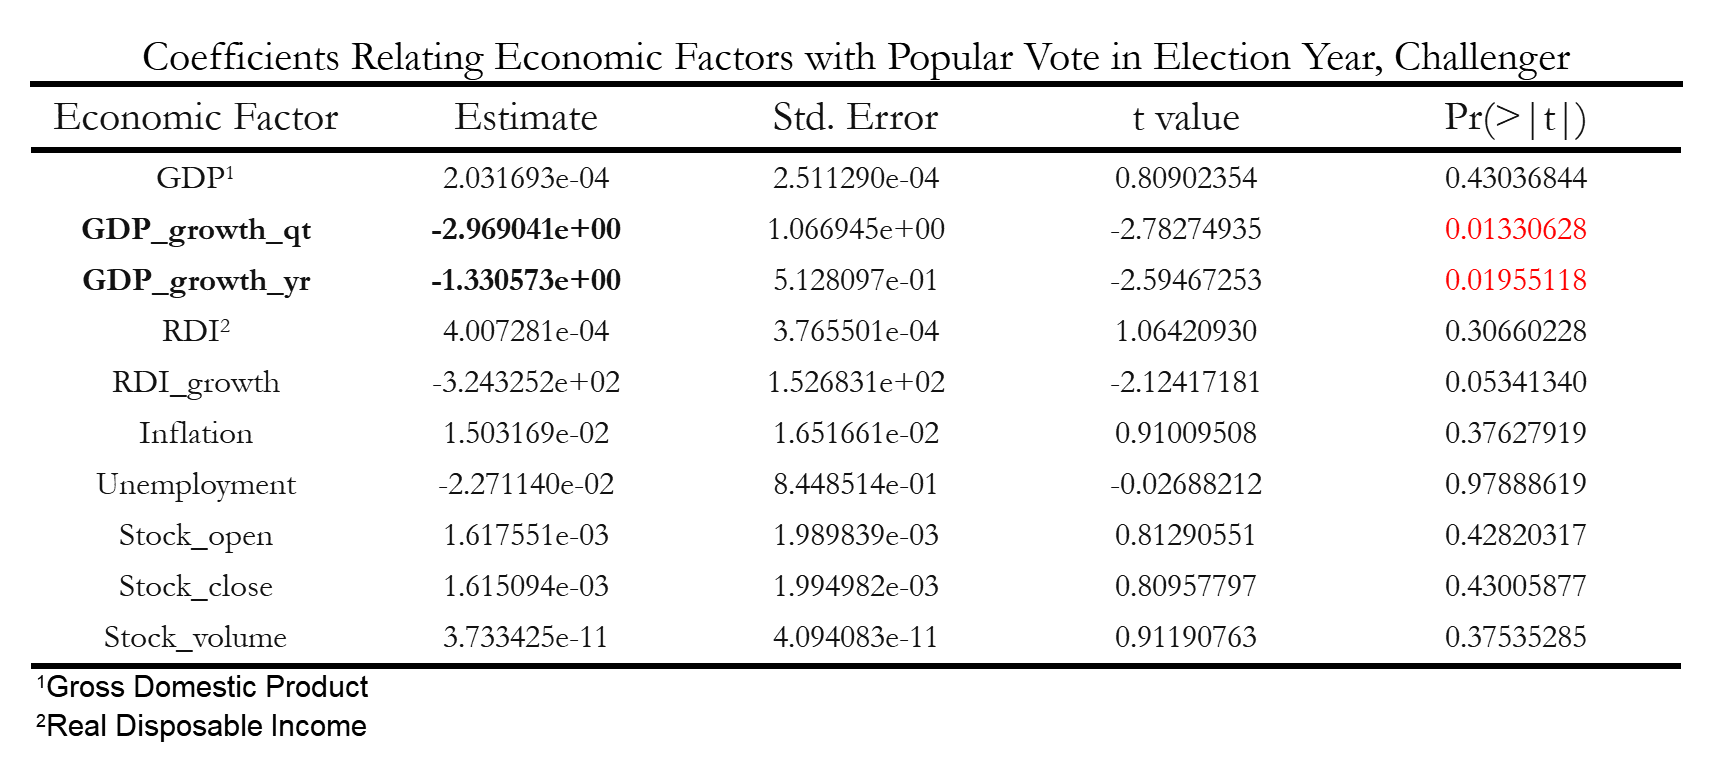 Figure 4: Coefficient Challenger
None of the t values were over 2, and the only pvalues that were less than 0.05 were GDP_growth_qr and GDP_growth_yr. Unfortunately, we aren’t able to get very significant conclusions from this analysis, so we will not be able to predict the percentages of the challenger using this model. However, we will use the three variables identified in the incumbency analysis with economy to see possible predictions for this year’s election with Trump.
Predictions?
Now using the variables we found through the economy and incumbency analysis, we can run a multivariate regression model analysis to see the interactions of these various economy variables together. The following regression analysis was run:
  incumbent_mod <- lm(pv2p ~ GDP_growth_qt +
                         GDP_growth_yr +
                         RDI_growth +
                         GDP_growth_qt*GDP_growth_yr*RDI_growth,
                    data = dat_incumbent)
Where the interactions between GDP_growth_qt, GDP_growth_yr, and RDI_growth were specifically observed. With this model, we have some interesting estimates of Trump’s popular vote predictions for this 2020 election.
When using 2020 quarter 1 economy data, we get the following result:
      fit      lwr      upr
  61.4618 43.83936 79.08424
This seems like a pretty high estimate: 61% of the popular vote, but when we compare this to the 2020 quarter 2 economy data we get an even more unrealistic result:
        fit       lwr      upr
  -395.0764 -2037.667 1247.515
Again, this is popular vote estimates of Trump at -395% which indicates that this model most likely is not the most accurate in determining the popular vote percentages of Trump in the 2020 election. It seems like when we combine the interactions of the three variables we selected, the effect of each variable magnifies in the same direction which provides us these unrealistic results. We definitely should take this into consideration in the future.
-
Brown, A. R. (2014).Voters Don’t Care Much About Incumbency. Journal of Experimental Political Science, 1(2):132–143 ↩
-
Campbell et al., 2017] Campbell, J. E., Norpoth, H., Abramowitz, A. I., Lewis-Beck, M. S.,Tien, C., Campbell, J. E., Erikson, R. S., Wlezien, C., Lockerbie, B., Holbrook, T. M.,and et al. (2017).A Recap of the 2016 Election Forecasts.PS: Political Science andPolitics, 50(2):331–338. ↩